13.4. Principal Components Analysis#
13.4.1. Code for Figures 13.20-13.22#
import numpy as np
import matplotlib.pyplot as plt
from matplotlib import cm


from sklearn import datasets

digits = datasets.load_digits(n_class=3)
mnist =  digits.data.T
Kmnist=np.cov(mnist)

lam1, U1 = np.linalg.eigh(Kmnist)
lam1_order = np.argsort(lam1)[::-1]

lam_mnist = lam1[lam1_order]
U_mnist = U1[:, lam1_order]
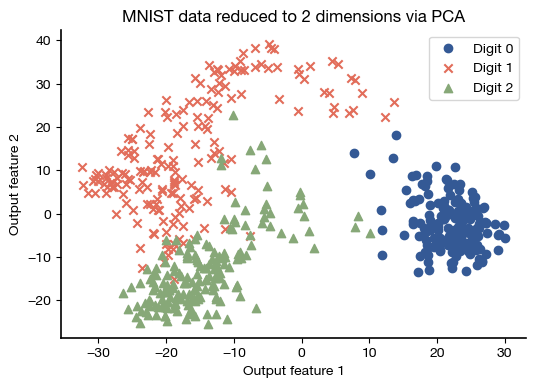
digits_pca = U_mnist.T[:2] @ mnist
markers = ['o', 'x', '^']
for digit_value in range(3):
  targets = np.where(digits.target == digit_value)
  plt.scatter(digits_pca[0,targets], digits_pca[1, targets],
              c='C'+str(digit_value), marker=markers[digit_value],
              label= f'Digit {digit_value}')
plt.xlabel('Output feature 1')
plt.ylabel('Output feature 2')
plt.title('MNIST data reduced to 2 dimensions via PCA');
plt.legend();

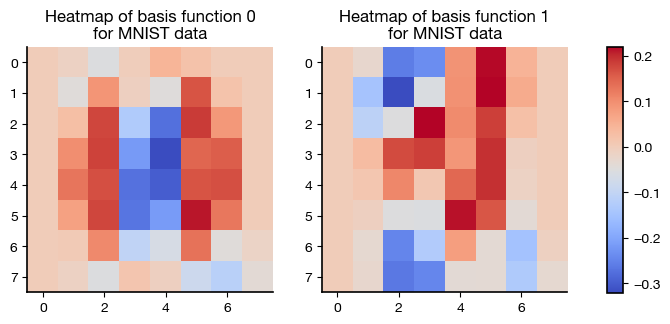
basis0 = U_mnist.T[0].reshape( (8,8) )
basis1 = U_mnist.T[1].reshape( (8,8) )
fig, axs = plt.subplots(1, 2, figsize=(8,6) )

axs[0].imshow(basis0, cmap=cm.coolwarm, vmin=-0.32, vmax=0.22)
axs[0].set_title('Heatmap of basis function 0\n'
          + 'for MNIST data');

im = axs[1].imshow(basis1, cmap=cm.coolwarm, vmin=-0.32, vmax=0.22)
axs[1].set_title('Heatmap of basis function 1\n'
          + 'for MNIST data');
fig.subplots_adjust(right=0.8)
cbar_ax = fig.add_axes([0.85, 0.29, 0.02, 0.41])
fig.colorbar(im, cax=cbar_ax, fraction=0.05)
<matplotlib.colorbar.Colorbar at 0x13c2253d0>

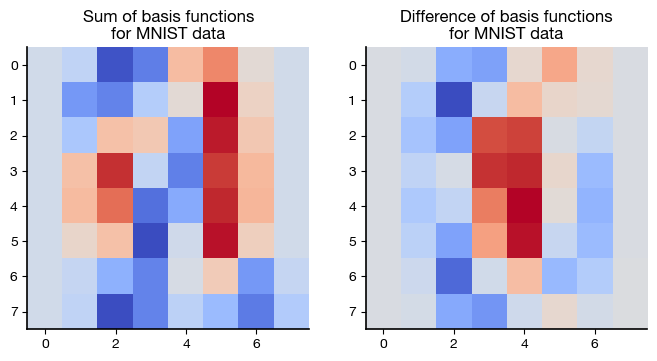
fig, axs = plt.subplots(1, 2, figsize=(8,6) )
axs[0].imshow(basis0 + basis1, cmap=cm.coolwarm)
axs[0].set_title('Sum of basis functions\n'
                 +'for MNIST data');
axs[1].imshow(basis1 - basis0, cmap=cm.coolwarm)
axs[1].set_title('Difference of basis functions\n'
                 +'for MNIST data');

13.4.2. Terminology Review#
Use the flashcards below to help you review the terminology introduced in this chapter. \(~~~~ ~~~~ ~~~~ \mbox{ }\)
