
5.8. Summary#
5.8.1. Key take-aways#
Statistical Studies
Statistical studies use data to try to answer a research question.
There are many different types of statistical studies, and each has its benefits and drawbacks.
Null Hypothesis Significance Tests (NHSTs)
NHSTs are used to determine whether an observed effect could be attributed to random sampling. If an effect is unlikely to be attributable to random sampling, then it may be called statistically significant.
The null hypothesis, denoted \(H_0\), is that the observed effect is not caused by any real difference in the underlying distributions of the data (i.e., it can be attributed to random sampling).
The alternative hypothesis, \(H_a\), is that the observed effect is caused by differences in the distributions of the data across groups.
In a NHST, the \(p\)-value is the probability of seeing a test statistic at least as extreme as that observed in the data when \(H_0\) is true.
The two possible outcomes of a NHST are either:
the null hypothesis is rejected, or
the null hypothesis fails to be rejected.
We never say that the alternative hypothesis is accepted or true. Because a NHST assumes that \(H_0\) is true, any conclusion can only be about \(H_0\).
If the null hypothesis is not rejected, that does not mean that the observed effect is not attributable to a real difference in the underlying distributions of the data. There may just be too little data to have sufficient confidence that the effect could not be caused by randomness in the samples.
NHSTs may be one-tailed or two-tailed. The choice should usually depend on the specific wording of the research question. If the research question does not imply a one-tailed test, a two-tailed test should be used.
Resampling in NHSTs
NHSTs can be conducted using resampling, in which the sampling distribution is approximated by drawing test samples from the original data.
When using resampling to conduct an NHST, the data is usually pooled, meaning that it is grouped together, since the null hypothesis usually corresponds to the assumption that all of the data comes from the same distribution.
In bootstrap resampling (or bootstrapping), test samples are drawn from the pooled data with replacement.
For implementing NHST with resampling, bootstrap resampling is usually used.
Alternatives to bootstrapping include permutation tests and Monte Carlo permutation tests.
Monte Carlo permutation test can be implemented almost identically to bootstrap resampling, except that sampling is done without replacement.
Permutation tests are usually more conservative (less likely to assign significance to an observed effect) than bootstrapping.
Bootstrap Distribution and Confidence Intervals (CIs)
Bootstrap distributions characterize the distribution of a statistic generated using bootstrapping.
CIs are a way of summarizing information about a statistic’s sampling distribution or bootstrap distribution.
Fo NHSTs, CIs can be used as an alternative to \(p\)-values.
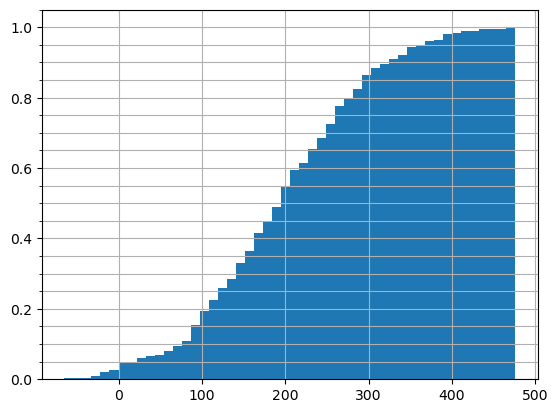
When using resampling, CIs are easily visualized using normalized cumulative histograms but are easiest to find using percentiles in the bootstrap samples of the test statistic.
CIs are often misinterpreted. A c% CI does not mean that there is a c% chance that the true value is in a given CI; instead, it means that were the data drawn many times and CIs created for each set of data, then the true value would be in c% of those CIs.
Error Types and Power
Statisticians and data scientists often refer to Type-I and Type-II errors. Type-I errors are false alarms; the probability of false alarm is often denoted by \(\alpha\). Type-II errors are false negatives; the probability of false negative is often denoted by \(\beta\).
A good way to remember Type I vs Type II errors is the story of the boy who cried wolf. The first time he cried wolf, there was no wolf, but the townspeople believe there was a wolf. This was a false positive, or Type I error. The second time he cried wolf, there was a wolf, but the townspeople did not believe there was a wolf. This was a false negative, or Type II error.
For a NHST, an acceptable level is chosen for \(\alpha\); this value is the significance threshold to which the \(p\)-value is compared.
Power is the probability of rejecting the null hypothesis when the alternative hypothesis is true; it is equal to \(1-\beta\). Because NHSTs assume \(H_0\) is true and make no assumptions about \(H_a\), they cannot provide any information about power or \(\beta\).
Self Assessment Exercises
Answer the questions below to assess your understanding of the material in this chapter. Because there are many questions for this chapter, a random sample of 10 questions are shown. Reload this page to get a new random sample of 10 questions.
Use the information in the following histogram to answer the questions below:
Terminology Review
Use the flashcards below to help you review the terminology introduced in this chapter. \(~~~~ ~~~~ ~~~~\)
Spaced Repetition
Use these questions to review material from previous chapter: