2.5. Chapter Summary#
Take-aways:
Computer simulations can be used to efficiently conduct experiments of random phenomena.
Scatter plots are a common visualization tool to see all the values of some numerical data.
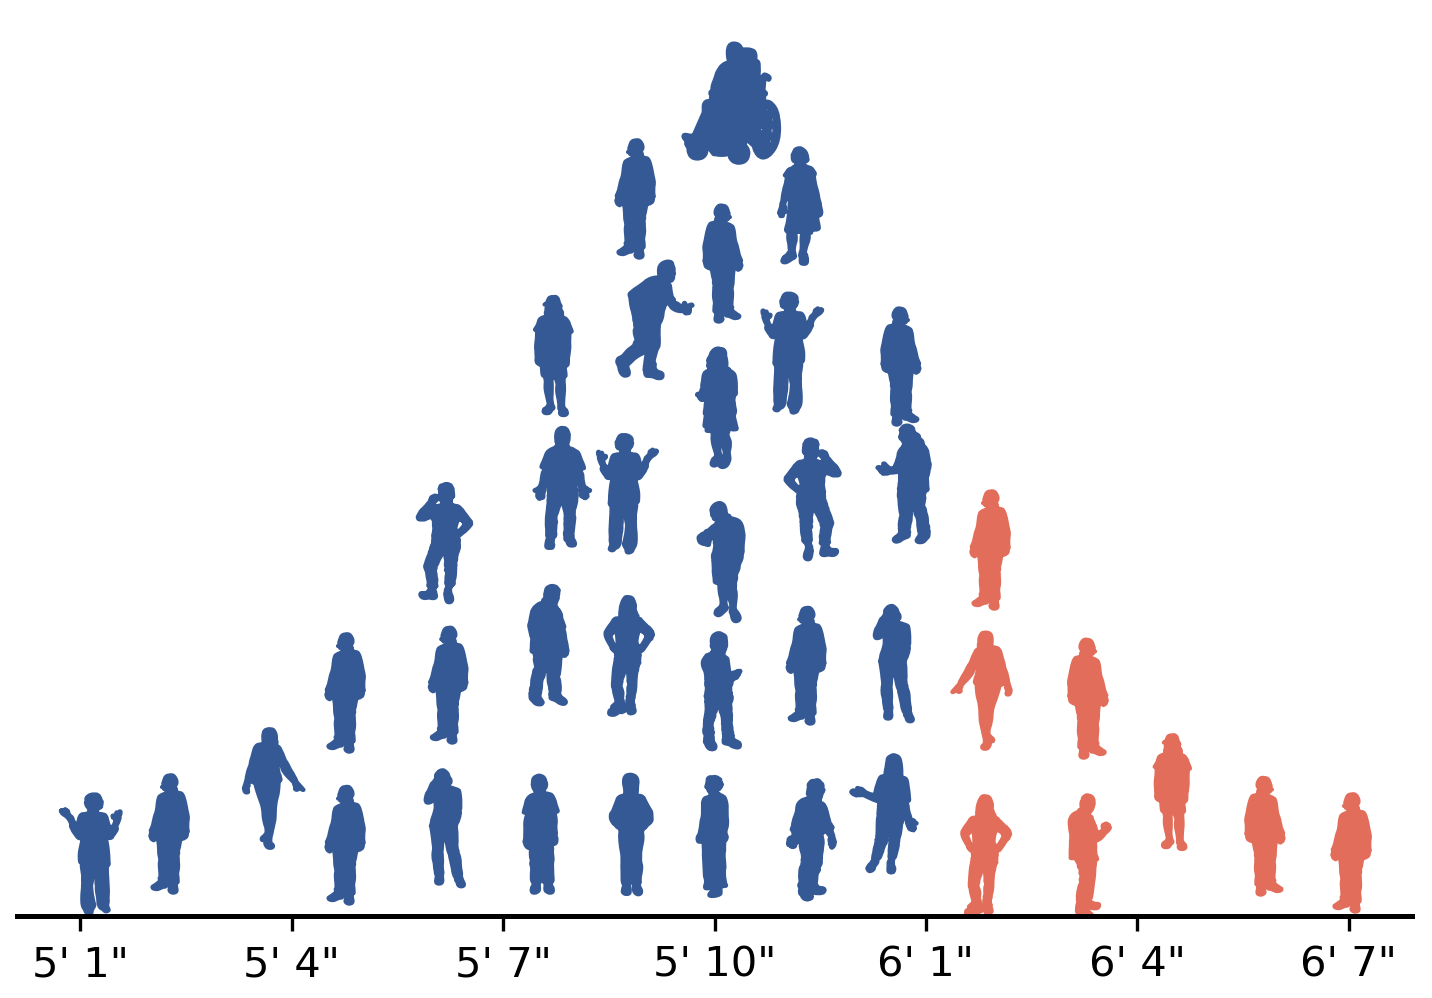
Histograms are a common visualization tool to see how the values of a numerical data set are distributed. Unlike scatter plots, the histogram summarizes information about the data: the values of the data cannot be recovered from the histogram.
The Relative frequency of an event is the proportion of experiments where that event occurred. For many experiments, if the number of observed experiment outcomes is large, the relative frequency will converge to the true probability of the event.
Simulations can be used to estimate the probability of some event by measuring the relative frequency.
Simulations can be used to determine how likely an observed event has occurred under specific experimental assumptions.
2.5.1. Terminology Review#
\(\mbox{ }\)
2.5.2. Self-Assessment Questions#
Self-Check:
The following questions can be used to check your understanding of the material covered in this chapter:
2.5.3. Spaced Repetition Review of Previous Chapter#
This chapter provides our first “spaced repetition review”. This is a pedagogical (i.e., teaching) technique that has been shown to improve retention. Starting with Chapter 2, you will be given review questions related to previous chapters to help you better retain that earlier material.
The spaced repetition questions are drawn randomly when the page is constructed. If you want to do additional review, just force a reload of the page in your browser, and a new set of random questions will be chosen.